RDS (Res Dar Saada) Market Analysis – Casablanca Stock Exchange
RDS (Res Dar Saada) is currently presenting a compelling investment opportunity for traders and investors. This article will explore the stock’s recent performance, technical outlook, and actionable strategies based on the latest market analysis.
Current Performance Overview
#RDS RES DAR SAADA Stock analysis on @TradingView: #Boursedecasablanca #Maroc #Moroccohttps://t.co/F5ckQF8eI3
— Marouane (@dogofallstreets) January 2, 2025
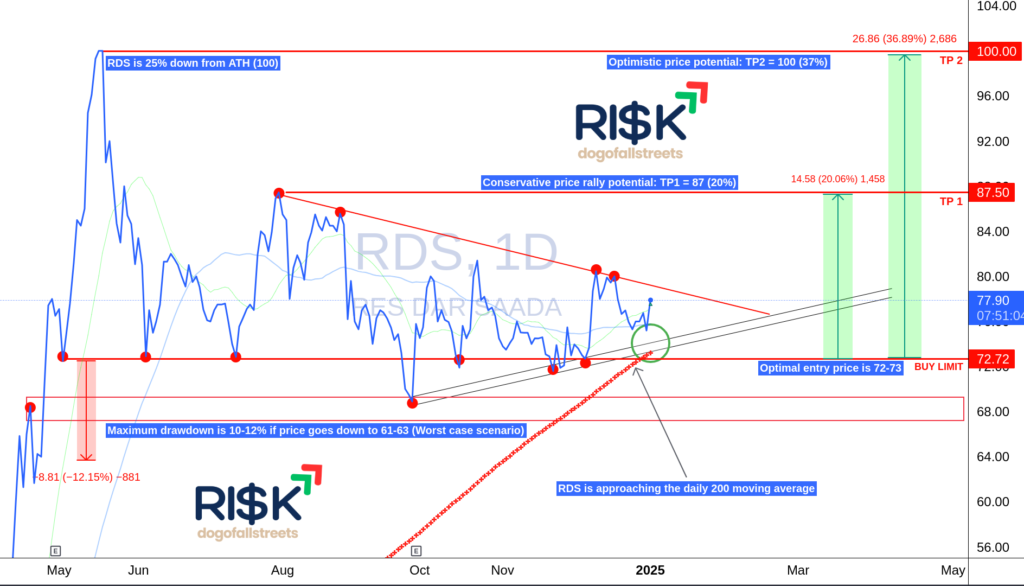
The stock is currently 25% down from its all-time high (ATH) of 100. This decline indicates a correction phase after a significant rally earlier in the year. Despite this drop, RDS is now approaching a critical support zone that aligns with its daily 200 moving average, which is known to act as a strong dynamic support level for many stocks. This convergence makes the stock an attractive candidate for potential recovery.
Key Entry Point and Risk Assessment
Optimal Entry Price:
- The optimal entry price range for RDS is between 72 and 73. This range is supported by:
- Proximity to the 200 moving average.
- Historical price behavior indicating strong support at this level.
Risk Factors:
- Maximum Drawdown Risk: In a worst-case scenario, the price may fall to the 61-63 range, representing a 10-12% downside risk. Traders and investors should factor this into their risk management strategy.
Price Targets for RDS
Conservative Target (TP1): 87.50
- This represents a 20% upside from the optimal entry point of 72-73. The target aligns with a previous resistance level and is realistic within a short-to-medium-term recovery rally.
Optimistic Target (TP2): 100
- A rally to 100 would mark a return to the stock’s ATH, offering a 37% upside from the entry price. Achieving this target may require strong bullish momentum fueled by market catalysts or positive company performance.
Technical Analysis by @dogofallstreets
Key Patterns and Indicators:
- Descending Triangle Pattern: The stock is forming a descending triangle, a pattern often associated with bearish trends. However, as the price nears a breakout zone, there is potential for upward momentum.
- Resistance Levels: The 87-90 range has historically acted as strong resistance. Breaking through this level would signal bullish confirmation and pave the way toward TP2.
- Support Strength: The 72-73 range has shown consistent buying interest, reinforcing its reliability as a support zone.
200 Moving Average:
The stock’s proximity to the 200 moving average provides additional confidence for a rebound. This moving average often acts as a psychological level for traders, further strengthening the entry point.
Actionable Strategy
1. Enter at 72-73
- Place limit orders within this range to secure an optimal entry point.
2. Stop-Loss Placement
- Protect your capital by placing a stop-loss at 61. This limits the downside risk to 10-12%.
3. Profit-Taking Strategy
- TP1 (87.50): Start taking profits here for a conservative gain of 20%.
- TP2 (100): For a more aggressive approach, hold the position until the price reaches its ATH, securing a 37% upside.
Market Sentiment and Outlook
RDS’s current position near its 200 moving average and strong support levels suggests a promising risk-reward scenario. However, traders should remain cautious of a potential breakdown below 61-63, which could indicate further weakness.
If market conditions improve or the company releases favorable news, a rally to the optimistic target (100) becomes increasingly likely. This makes RDS an appealing choice for both short-term traders and long-term investors.
Conclusion
RDS (Res Dar Saada) offers an excellent opportunity for investors looking to capitalize on its current correction phase. With an optimal entry range of 72-73, a conservative price target of 87.50, and an optimistic target of 100, the stock presents a balanced risk-reward profile. As always, ensure you have a robust risk management plan in place to navigate potential market volatility.
Stay tuned to Risk.ma for more market insights and actionable investment strategies!